


Bullish Pennant chart pattern structure
Bearish Pennant chart pattern structure
3. Bullish and bearish symmetric triangles
Human psychology is all about patterns. Patterns define our behaviour and help us follow the rules. The same principles apply to the Forex market. It has patterns that allow us to forecast future prices correctly. Let's take a closer look at ten patterns you should know to be ready to trade. Understanding these patterns can significantly increase your profit potential in your trading journey.

Trading patterns act as graphic signs and cues. They help traders determine the best times to buy or sell, or, in other words, to find entry and exit points. Spotting them can greatly contribute to conducting technical analysis and developing a trading strategy. Let's explore the main types of chart patterns. Pennants are a popular trading pattern. The pattern can be bullish or bearish. Like Flag formations, both bullish and bearish are continuation patterns. They indicate that the current trend is going to continue after a slight pause. The Bullish Pennant pattern on the chart has characteristics similar to those of the flag pattern. However, the pennant pattern looks more like a triangle.Common trading patterns
1. Pennant
Bullish Pennant chart pattern structure
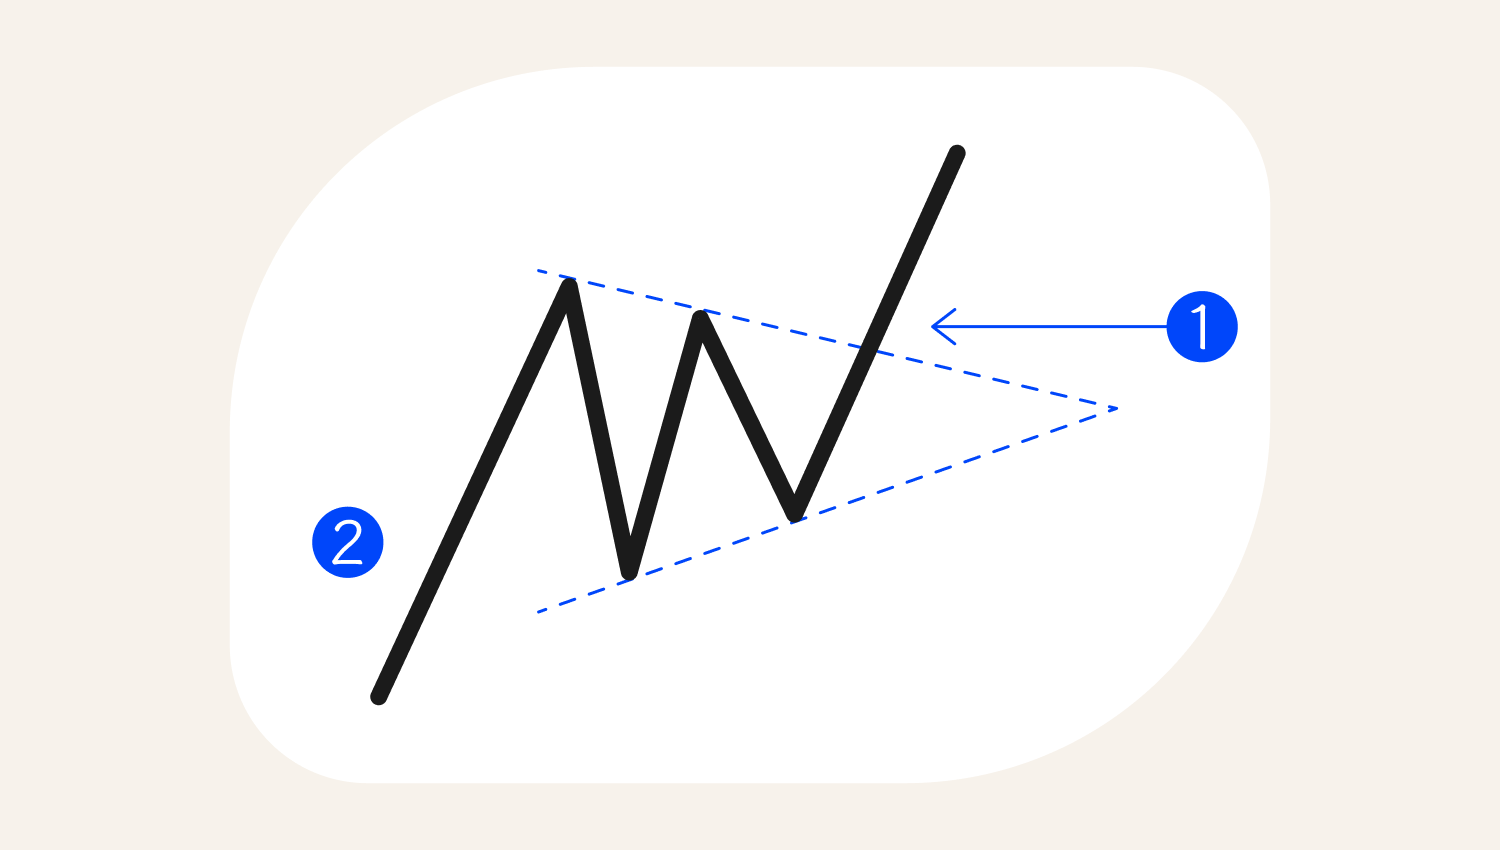
1. Breakout of the bullish pennant, indicating trand continuation
2. Flagpole
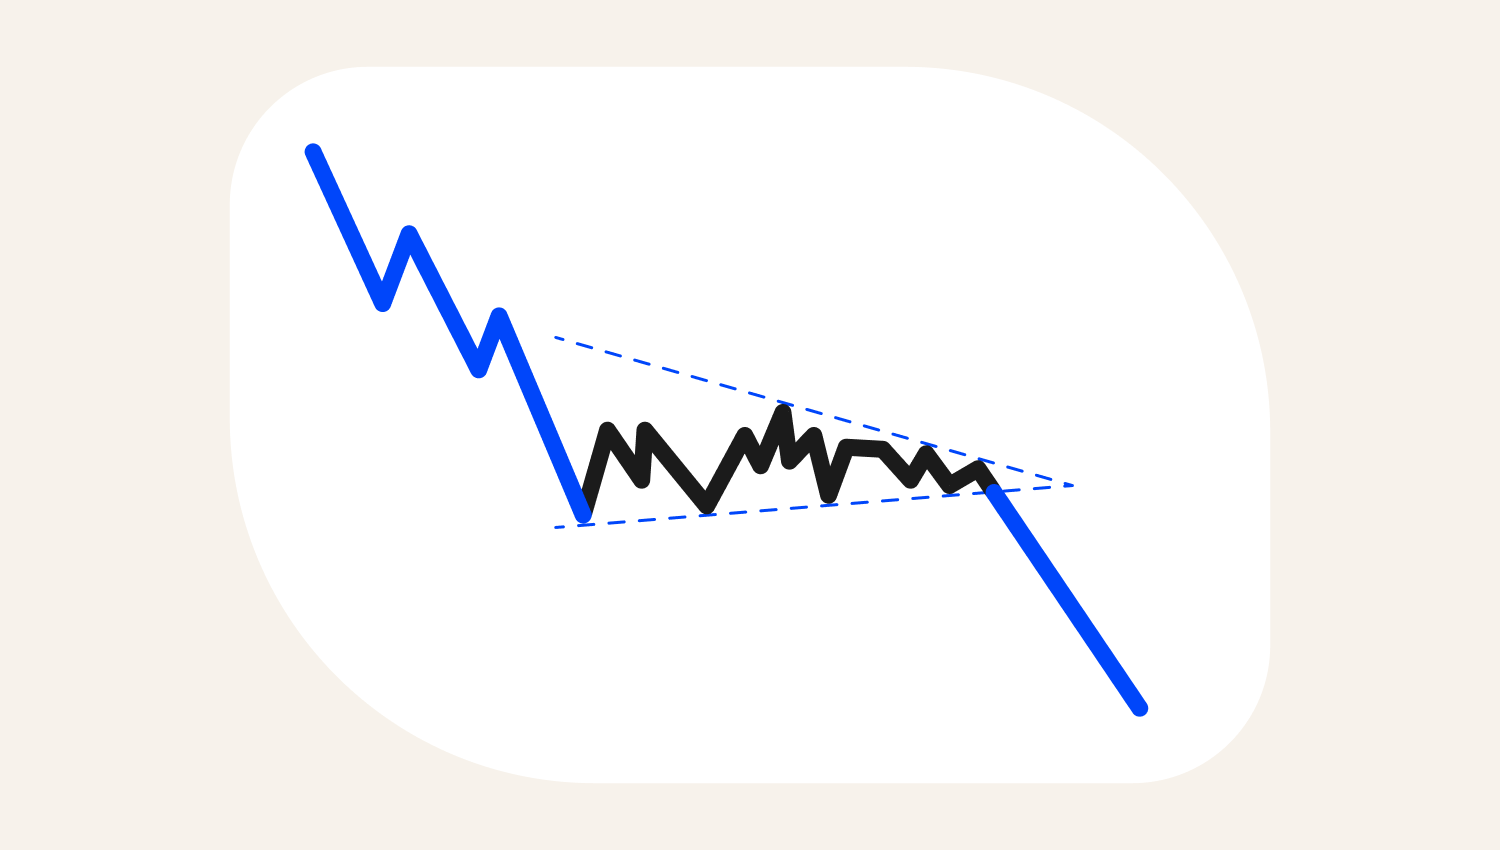
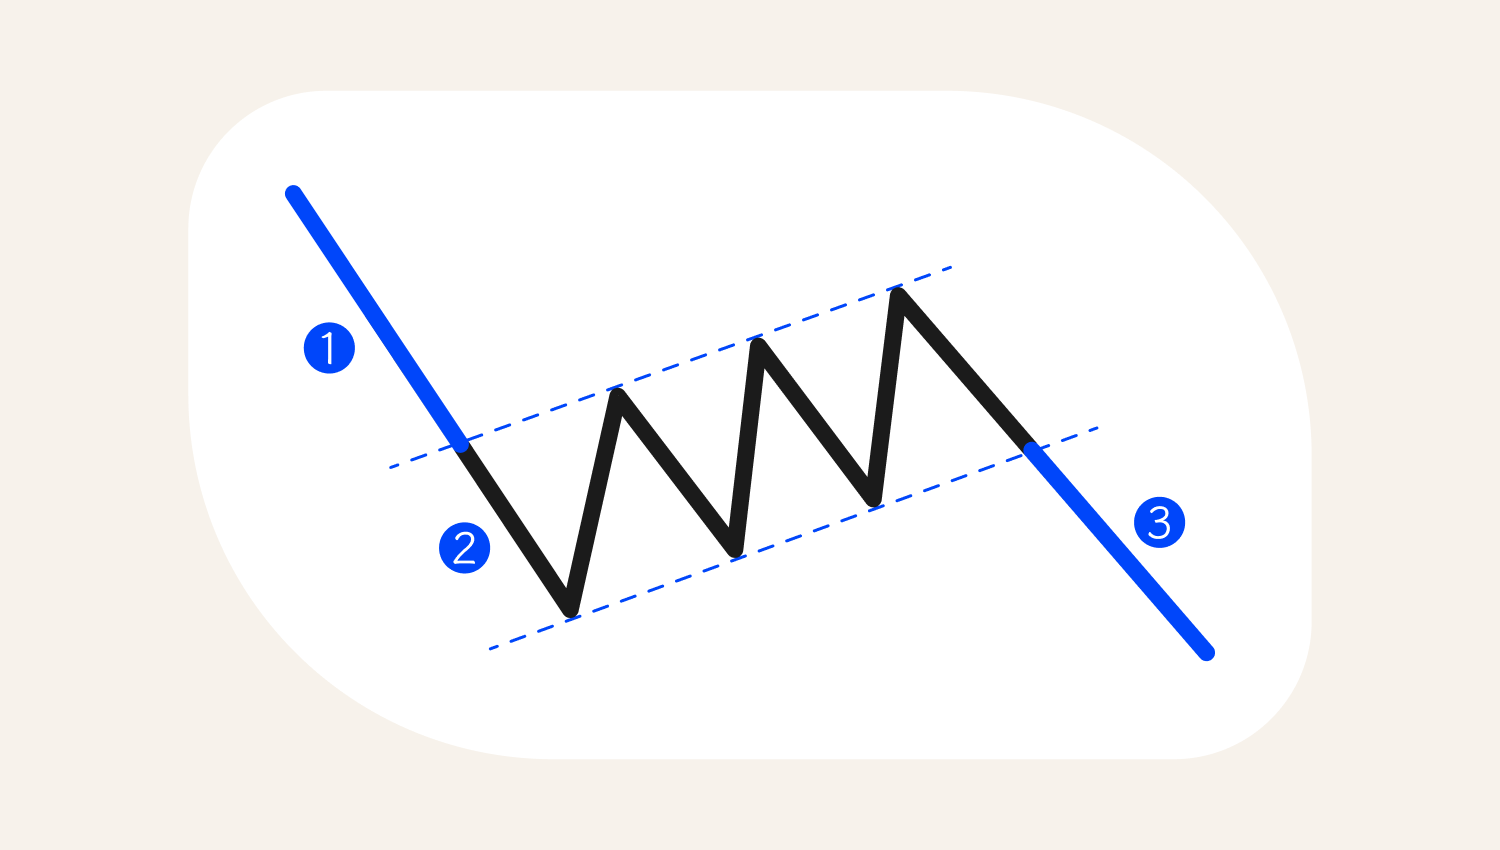
Bearish Pennant chart pattern structure
A Bearish Pennant pattern is a bearish trend continuation pattern. It resembles a bearish flag, but its shape looks more like a triangle than a flag.
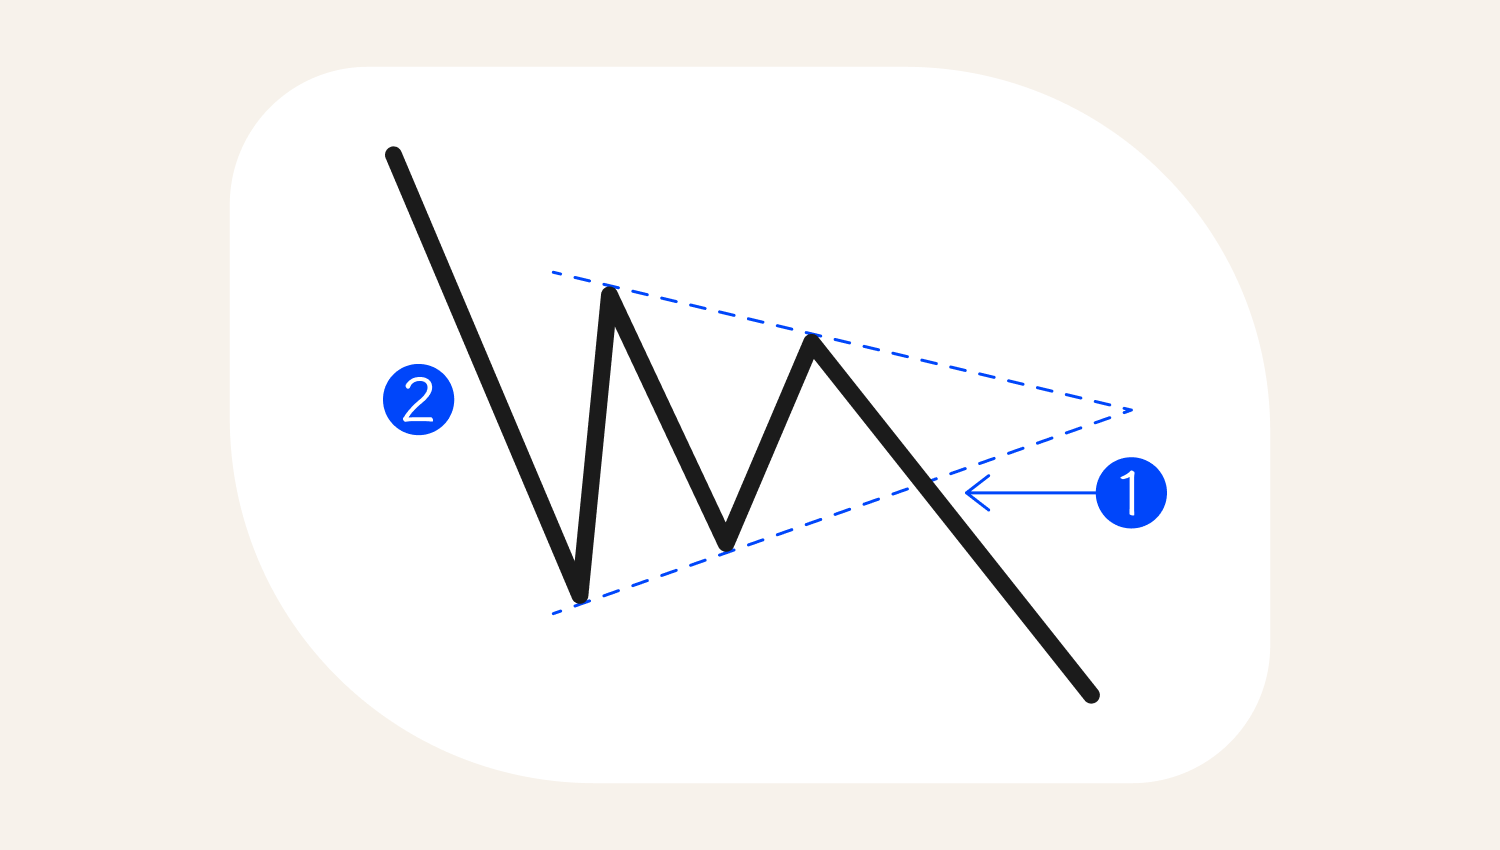
1. Breakout of the Bearish pennant, indicating downward continuation
2. Flagpole
The Bullish Pennant pattern is shown in the chart below.
1. Breakout
2. Cup and Handle
It is a simple-looking pattern that makes sense once you look at the chart. It looks exactly like a cup with—yeah, you guessed it—a handle. The cup makes a U-shape, and the handle goes slightly downward—where you know the trend will go up.
Make yourself a cup of steaming tea and get ready for the price going up.
1. Cup
2. Handle
3. Breakout
3. Bullish and bearish symmetric triangles
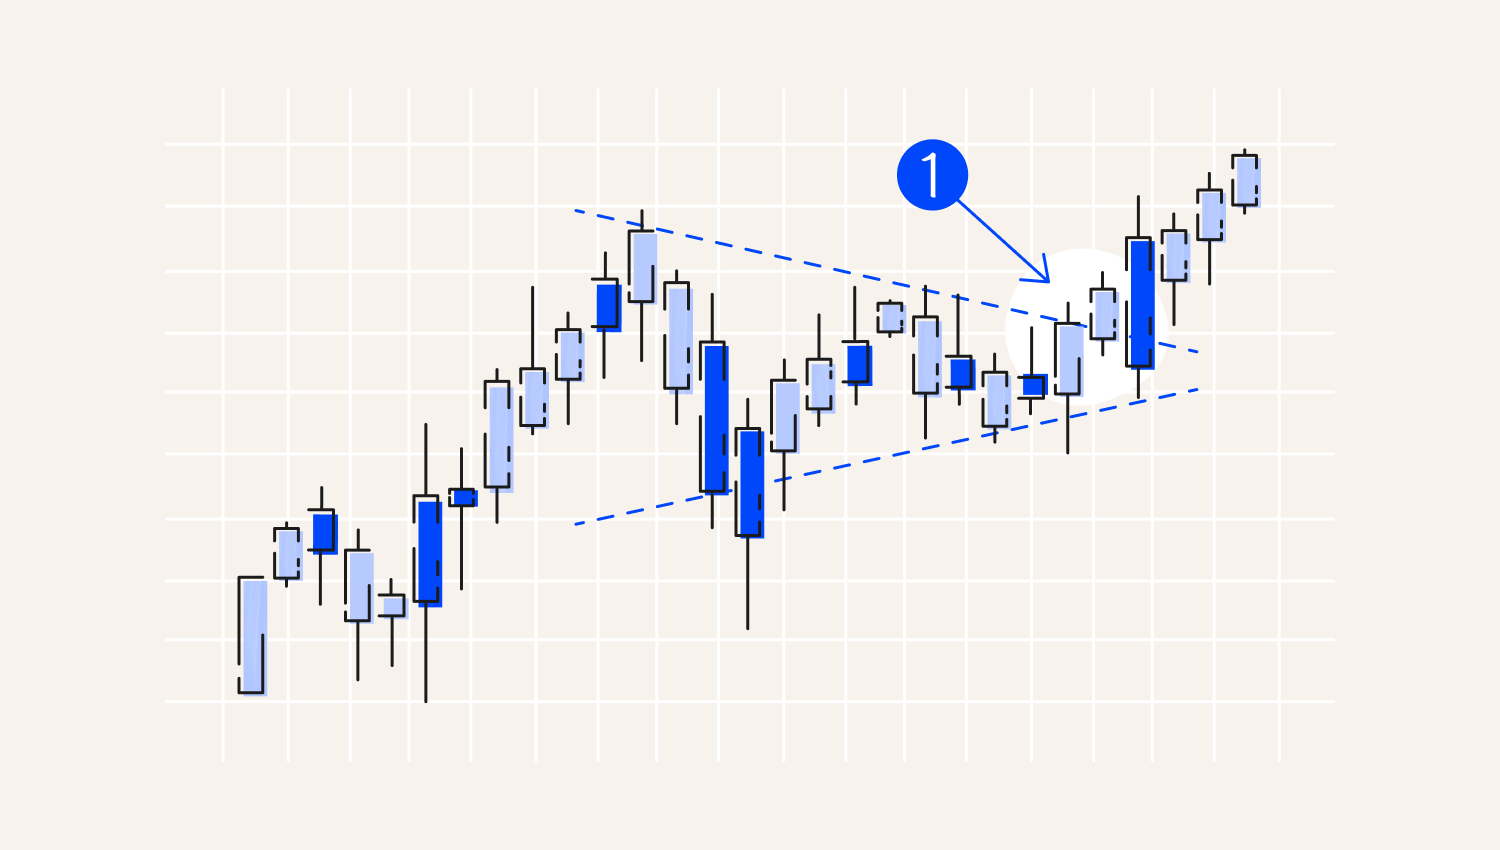
A Symmetrical Triangle is one of the basic patterns used in technical analysis by both experienced traders and beginners. It indicates a period of market uncertainty, appearing when the price forms a narrowing range with lower highs and higher lows. This tightening range suggests a temporary balance between bears and bulls. While the Symmetrical Triangle itself does not guarantee the direction of the breakout, traders often look to the prior trend for clues about the likely outcome.
Bullish symmetric triangles
A bullish Symmetrical Triangle pattern typically forms during an uptrend. Although the pattern reflects market indecision, it often suggests a potential continuation of the bullish trend if the price breaks out upward from the triangle.

Bearish symmetric triangles
A bearish Symmetrical Triangle pattern typically forms during a downtrend. While uncertainty exists during the formation, a downside breakout signals a potential continuation of the bearish trend.
Here are the chart examples of bullish and beasrish symmetric triangles:
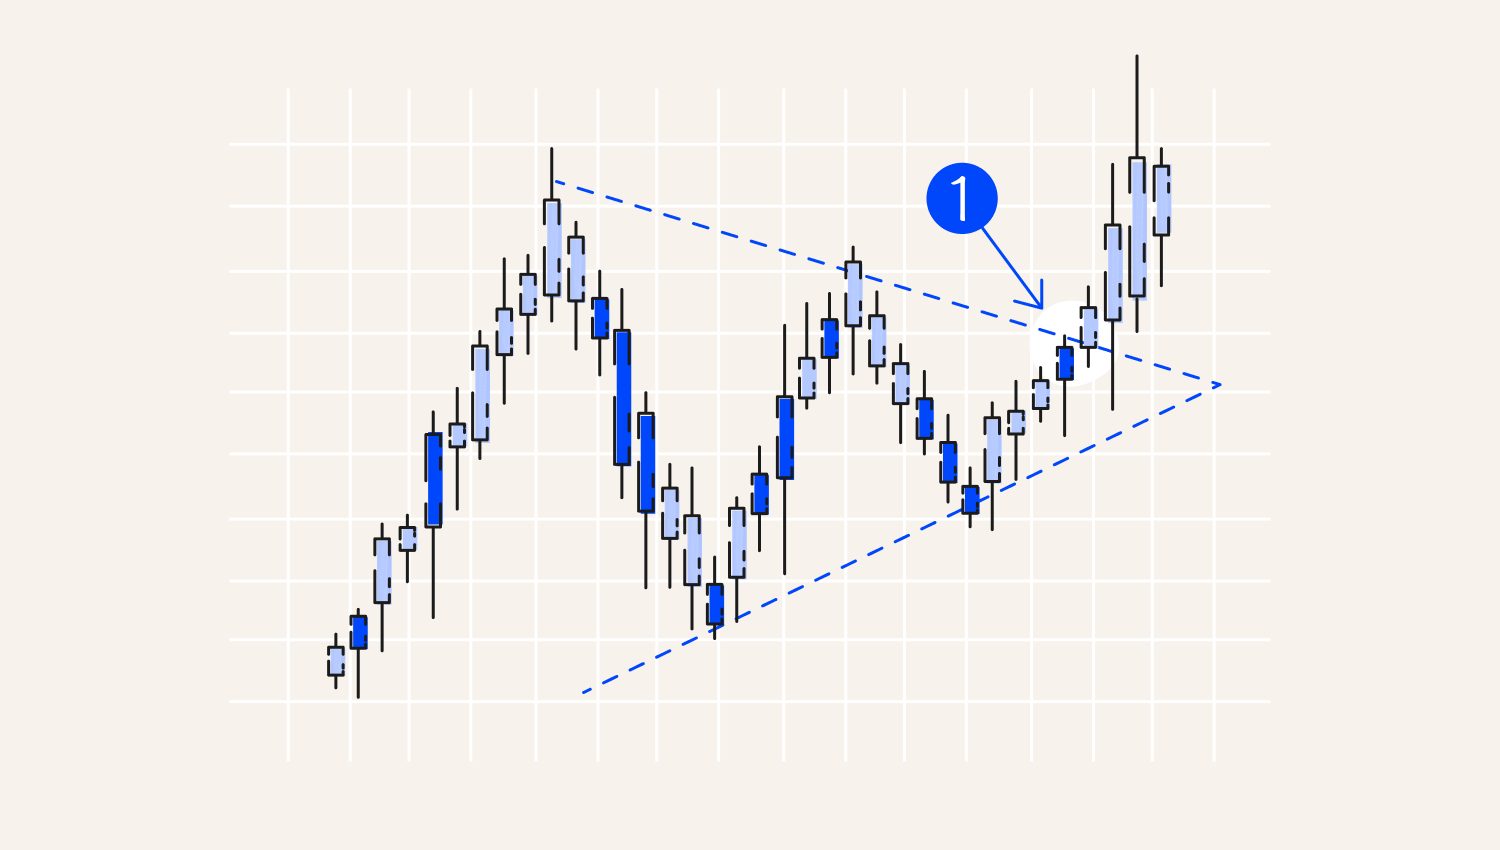
1. Breakout
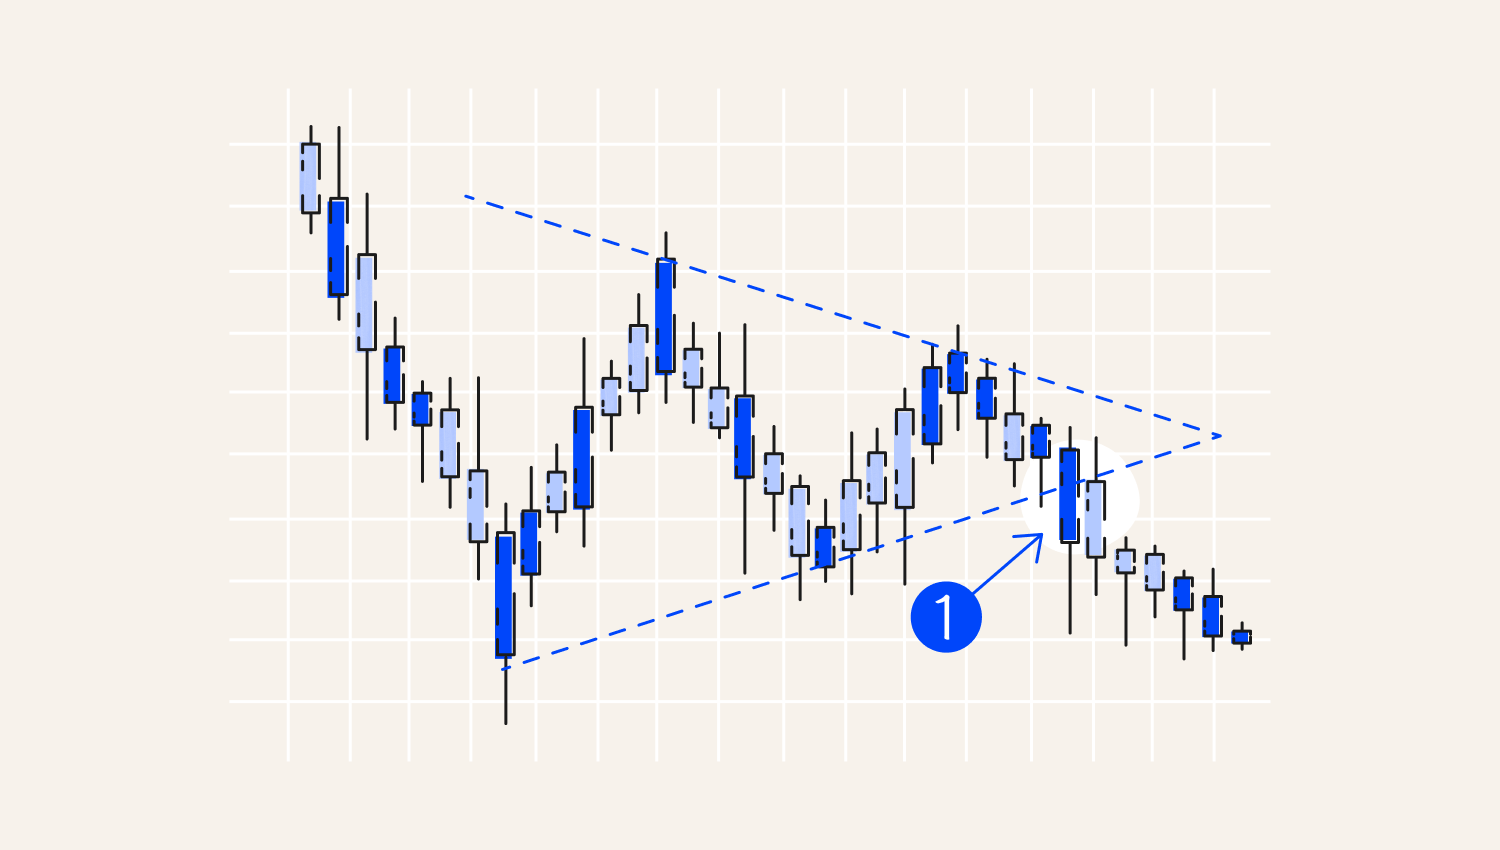
1. Breakout
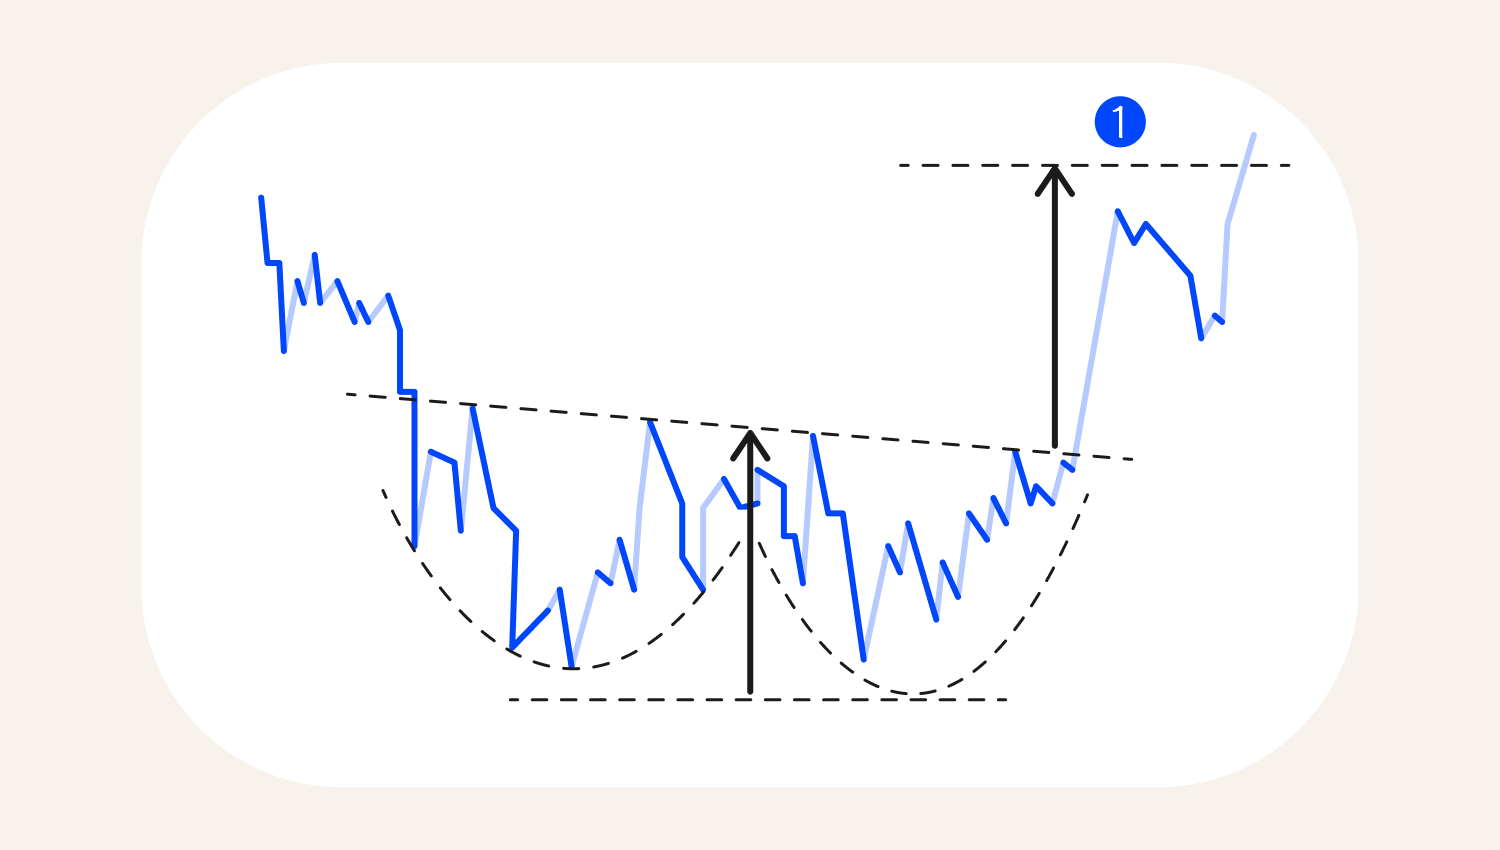
4. Rounding Bottom
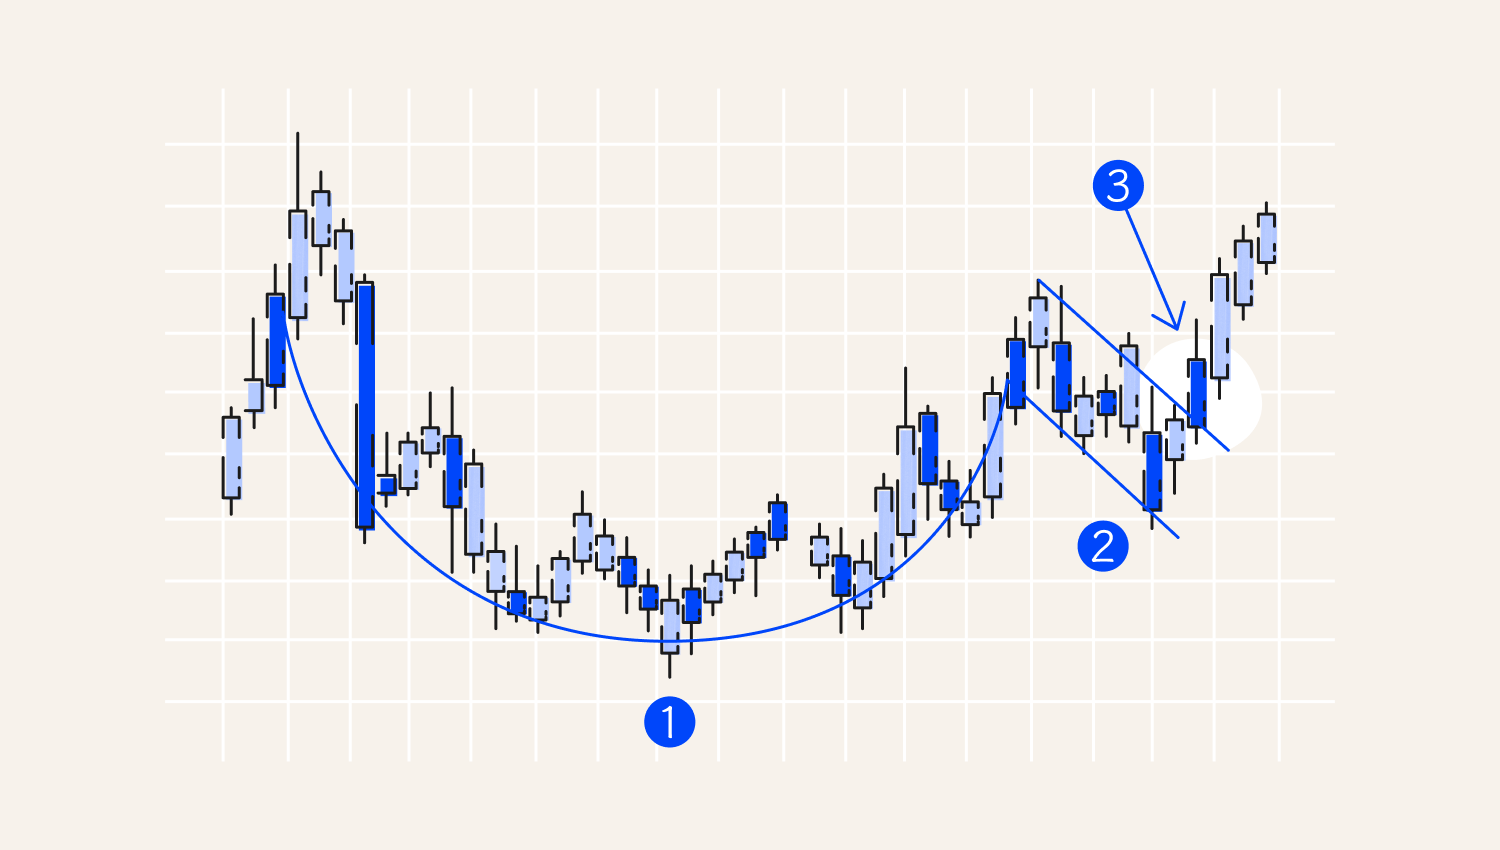
What goes around comes around—and the Rounding Bottom pattern illustrates this perfectly. In this formation, the price gradually declines and then slowly rises, creating a smooth, rounded bowl shape (without a handle, unlike a Cup and Handle pattern!). The Rounding Bottom is a long-term reversal pattern, often visible over several months or even years, and it can be a powerful tool for analyzing major market transitions from bearish to bullish sentiment.
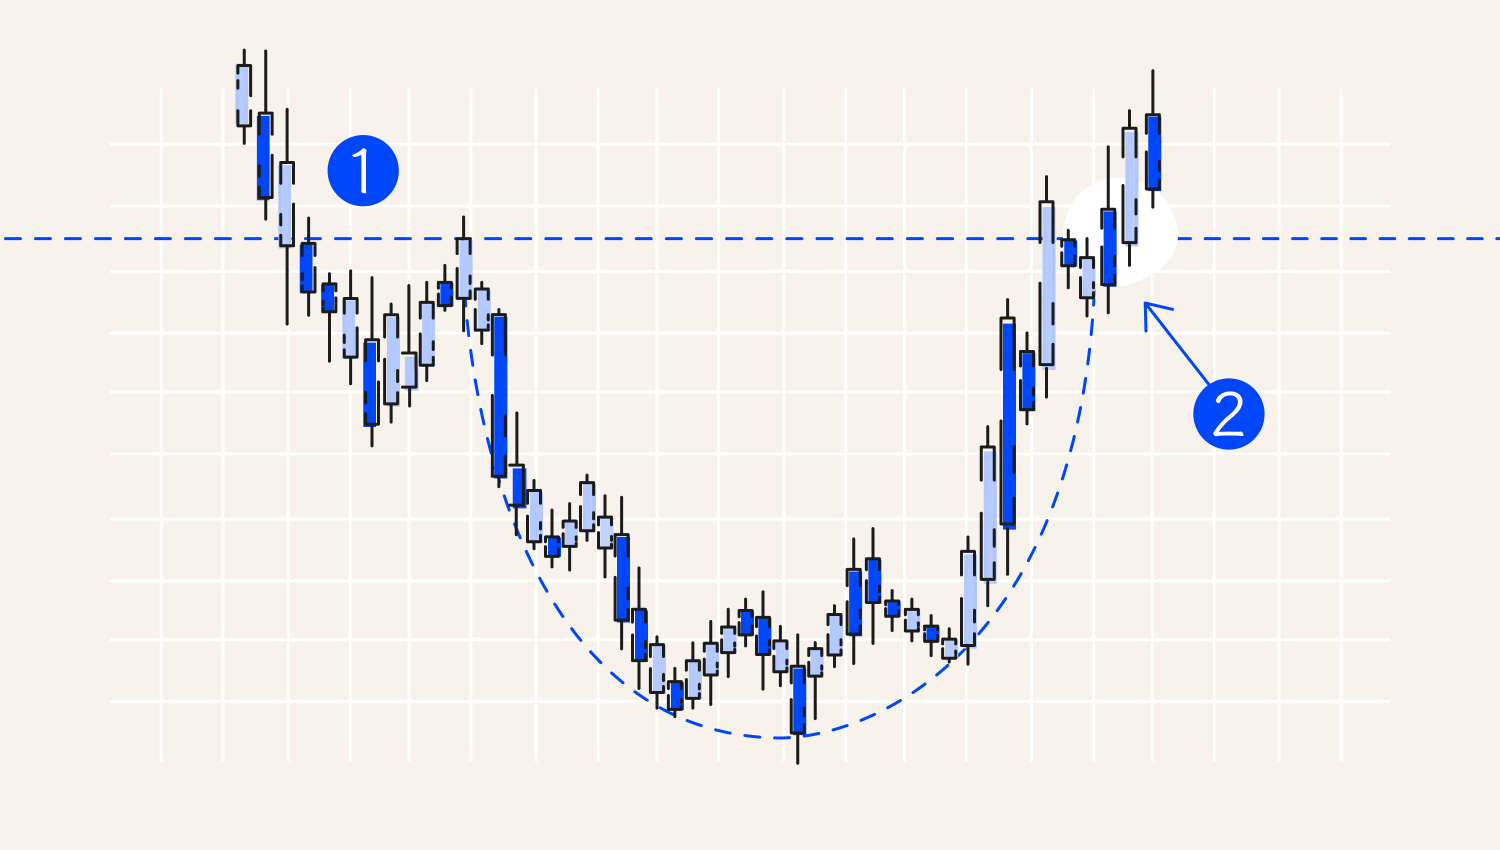
1. Downtrend
2. Breakout and Trend Reversal
5. Bearish and Bullish Flags
As the name suggests, a flag pattern resembles a flag on a pole. To be considered a bullish flag, the pattern typically includes:
- A flagpole — a sharp, strong upward move, forming higher highs (HH) and higher lows (HL).
- A flag — a downward-sloping or sideways channel, made up of candlesticks forming lower highs (LH) and lower lows (LL), contained between parallel support and resistance lines.
- A breakout — ideally, the price breaks out upward through resistance to continue the prior bullish trend.
Similarly, a bearish flag forms after a strong downward move (the flagpole), followed by an upward-sloping or sideways flag, before typically breaking downwards to continue the bearish trend.
The bearish flag is shown below:
1. Flagpole
2. Flag
3. Breakout confirming the bearish continuation
1. Breakout
6. Descending Triangle
A Descending Triangle is a bearish chart pattern that signals potential downward movement. It features a flat support line at the bottom and a descending resistance line at the top, as sellers gradually push prices lower. If the price breaks below the support line, it often confirms the pattern and suggests that further declines may follow.
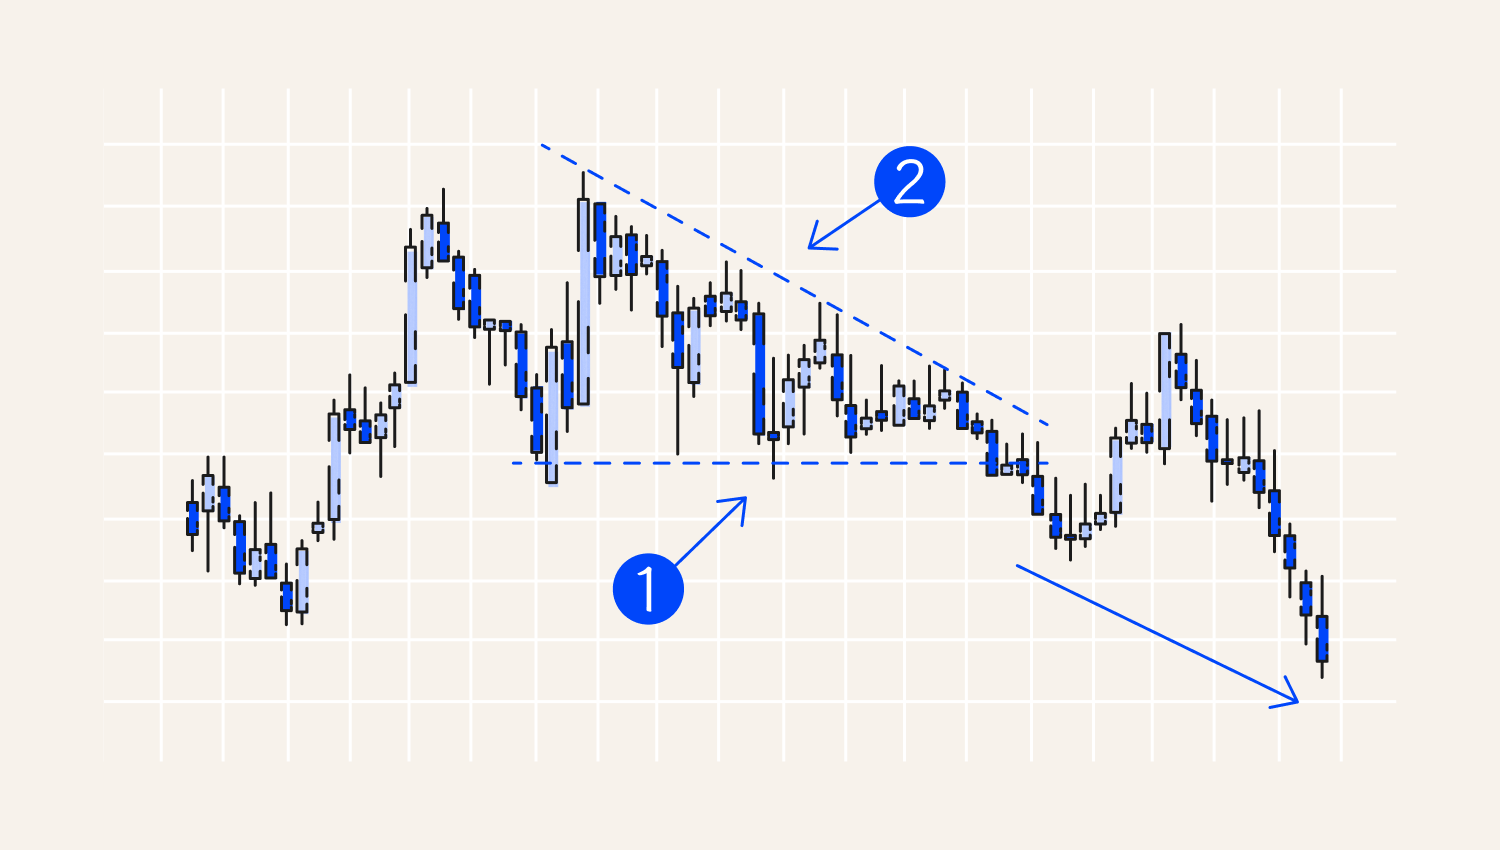
1. Horizontal support line
2. Angled resistance line
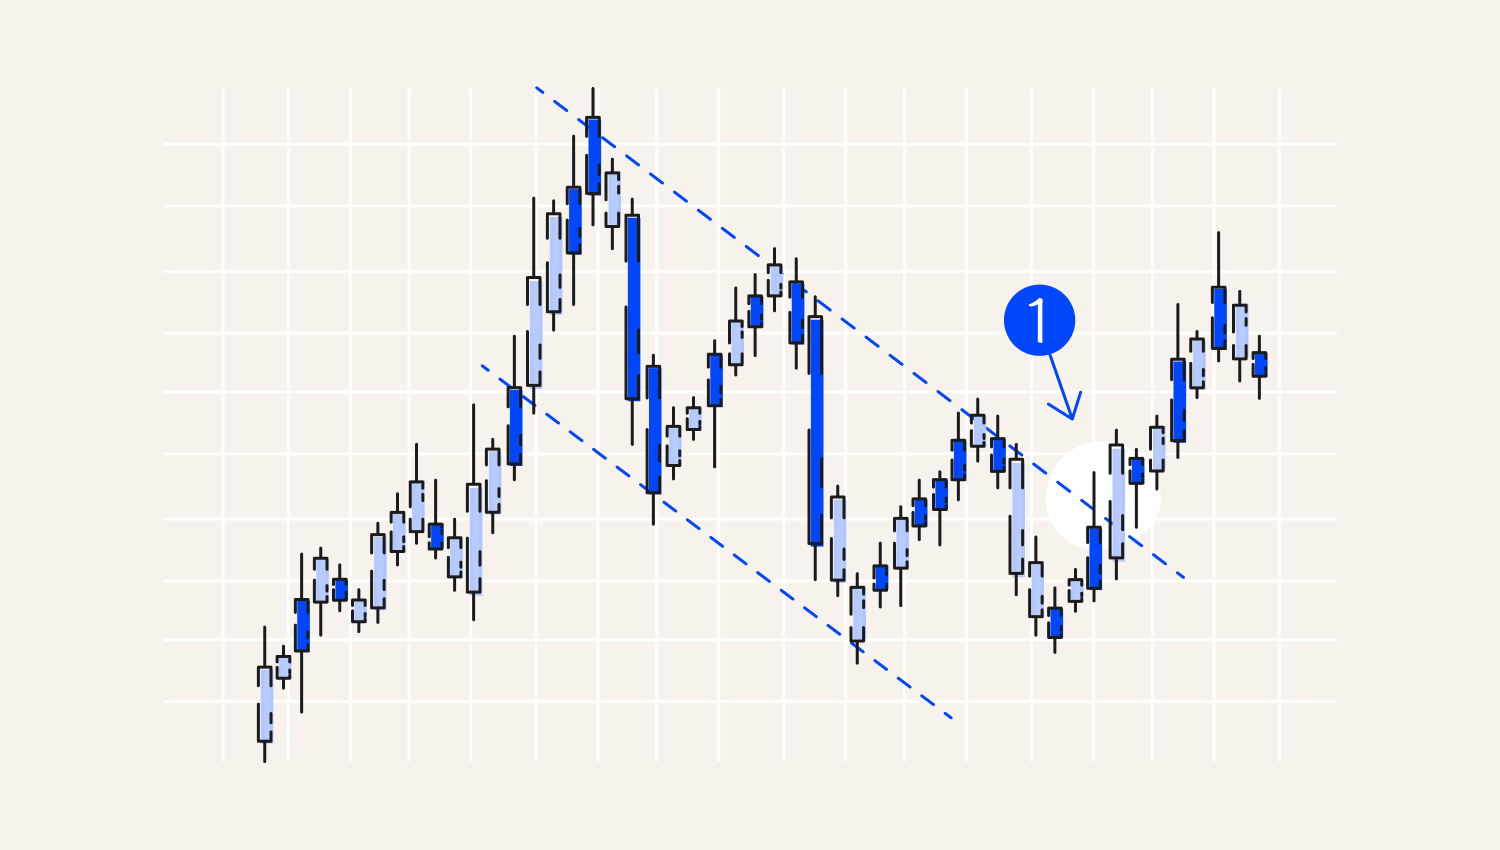
7. Wedge
Wedges are chart patterns formed by two converging slanted lines. They can slope upward (rising wedge) or downward (falling wedge), with the price moving within the narrowing range. Wedges are typically considered reversal patterns, meaning the price often breaks out in the opposite direction of the wedge's slope:
- A falling wedge often signals a potential upward breakout.
- A rising wedge often signals a potential downward breakout.
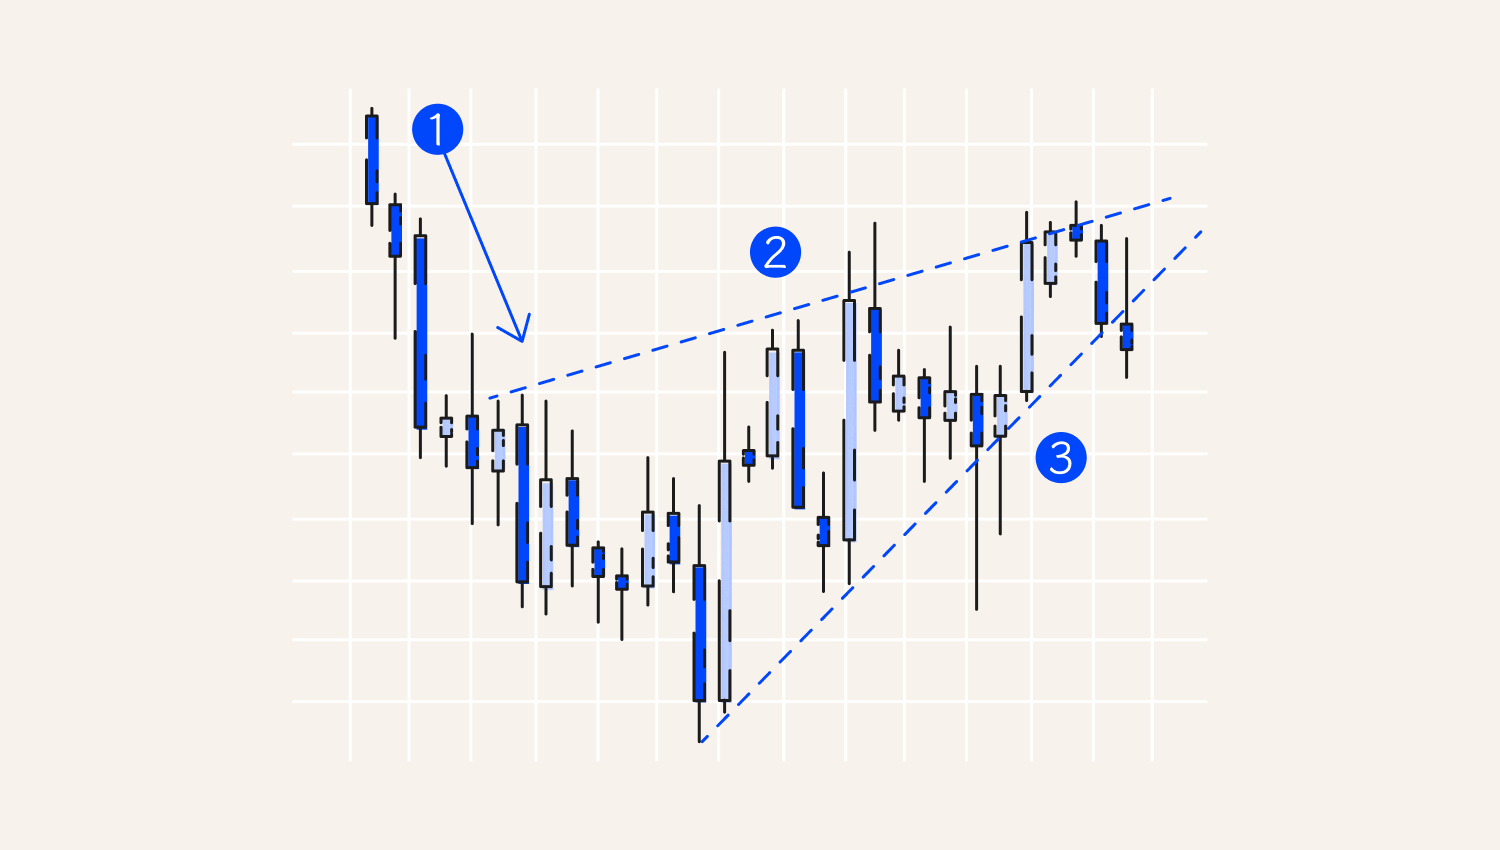
1. Downtrend
2. Higher highs
3. Higher lows
8. Double Bottom
The Double Bottom is a market structure that indicates a potential bullish reversal. It signals that the prevailing downtrend may be ending, and an upward move could follow. The pattern is often seen in the Forex, cryptocurrency, stock, and commodity markets and is used by both swing traders and day traders. A Double Bottom graphically resembles the letter 'W', forming when the price tests a support level twice without breaking below it before moving higher.
1. Target
9. Double Top
The Double Top is a market structure that indicates a potential bearish reversal. It forms when the price attempts to break above a resistance level twice but fails both times, suggesting that selling pressure is building. After the second peak, the price often begins to decline. Visually, a Double Top resembles the letter 'M' on the chart.
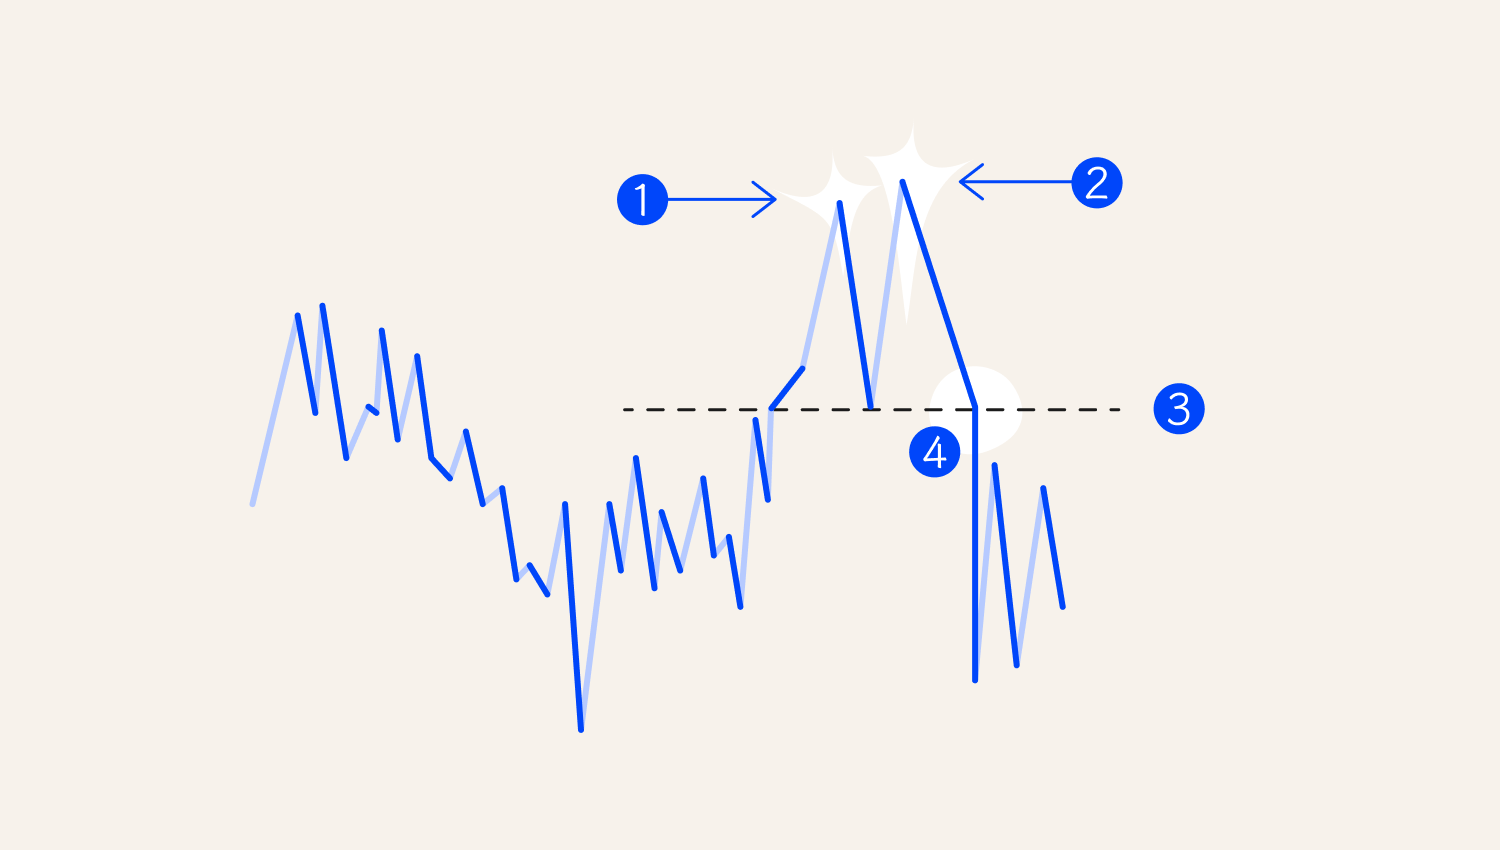
1. First peak
2. Second peak
3. Neckline
4. Breakout
10. Head and Shoulders
The Head and Shoulders pattern is a classic bearish reversal signal. It features three peaks: a higher middle peak (the head) flanked by two lower peaks (the shoulders) on either side. This pattern typically forms after an uptrend and suggests that buying momentum is weakening. When the price breaks below the neckline—a support level drawn between the two troughs—it signals a potential trend reversal from bullish to bearish.
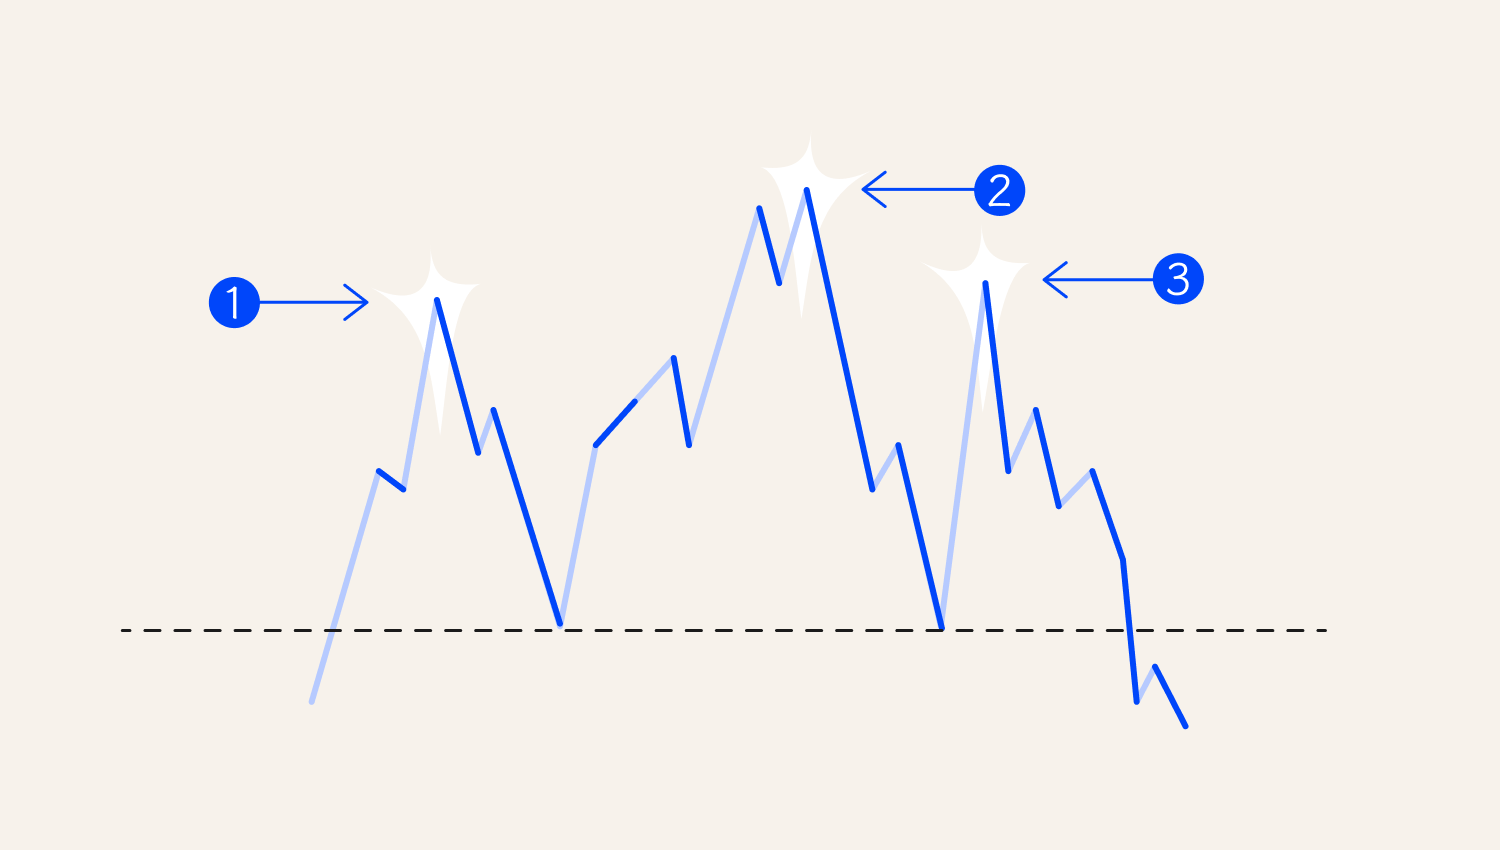
1. Shoulder
2. Head
3. Shoulder
Final thoughts
